Index Trend Analysis Report
Prepared for you on Friday, April 26, 2024.
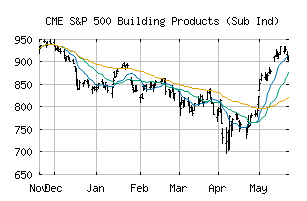
S&P 500 Building Products (Sub Ind) (CME:SP500-20102010)
Weak Uptrend (+65) - SP500-20102010 is showing signs of weakening momentum to the upside. Monitor SP500-20102010 as it may be in the beginning stages of a reversal.
Is it time to buy, sell, or avoid SP500-20102010?
MarketClub looks at technical strength and momentum to determine if the timing is right for SP500-20102010.
Learn more about the Trade Triangles and how we make technical analysis as easy as buy and sell.
|
|||||||||||||||
|
|||||||||||||||
MarketClub’s Trade Triangles for SP500-20102010
![]() The long-term trend has been UP since Dec 8th, 2023 at 635.29
The long-term trend has been UP since Dec 8th, 2023 at 635.29
![]() The intermediate-term trend has been DOWN since Apr 12th, 2024 at 740.06
The intermediate-term trend has been DOWN since Apr 12th, 2024 at 740.06
![]() The short-term trend has been UP since Apr 23rd, 2024 at 735.94
The short-term trend has been UP since Apr 23rd, 2024 at 735.94
Smart Scan Analysis for SP500-20102010
Based on our trend formula, SP500-20102010 is rated as a +65 on a scale from -100 (Strong Downtrend) to +100 (Strong Uptrend).
| Open | High | Low | Price | Change |
|---|---|---|---|---|
| 747.03 | 757.58 | 747.03 | 755.54 | +8.27 |
| Prev. Close | Volume | Bid | Ask | Time |
| 747.27 | 18968495 | 2024-04-26 16:19:53 |
| 52wk High | 390.27 | 52wk High Date | 2018-01-26 |
| 52wk Low | 272.55 | 52wk Low Date | 2018-10-29 |