Index Trend Analysis Report
Prepared for you on Friday, May 9, 2025.
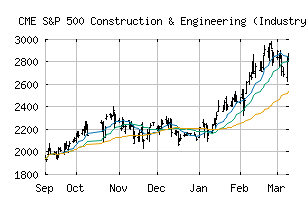
S&P 500 Construction & Engineering (Industry) (CME:SP500-201030)
Long-Term Uptrend (+90) - SP500-201030 is in a strong uptrend that is likely to continue. While SP500-201030 is showing intraday weakness, it remains in the confines of a bullish trend. Traders should use caution and utilize a stop order.
Is it time to buy, sell, or avoid SP500-201030?
MarketClub looks at technical strength and momentum to determine if the timing is right for SP500-201030.
Learn more about the Trade Triangles and how we make technical analysis as easy as buy and sell.
|
|||||||||||||||
|
|||||||||||||||
MarketClub’s Trade Triangles for SP500-201030
![]() The long-term trend has been UP since May 1st, 2025 at 1659.09
The long-term trend has been UP since May 1st, 2025 at 1659.09
![]() The intermediate-term trend has been UP since Apr 23rd, 2025 at 1437.73
The intermediate-term trend has been UP since Apr 23rd, 2025 at 1437.73
![]() The short-term trend has been UP since May 8th, 2025 at 1682.86
The short-term trend has been UP since May 8th, 2025 at 1682.86
Smart Scan Analysis for SP500-201030
Based on our trend formula, SP500-201030 is rated as a +90 on a scale from -100 (Strong Downtrend) to +100 (Strong Uptrend).
| Open | High | Low | Price | Change |
|---|---|---|---|---|
| 1691.94 | 1712.32 | 1681.67 | 1689.33 | +13.77 |
| Prev. Close | Volume | Bid | Ask | Time |
| 1689.33 | 1167936 | 2025-05-08 16:19:08 |
| 52wk High | 307.73 | 52wk High Date | 2018-01-29 |
| 52wk Low | 241.41 | 52wk Low Date | 2018-05-07 |