Index Trend Analysis Report
Prepared for you on Thursday, March 26, 2026.
S&P 500 Construction & Engineering (Sub Ind) (CME:SP500-20103010)
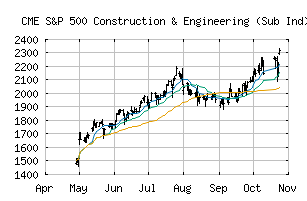
Long-Term Uptrend (+90) - SP500-20103010 is in a strong uptrend that is likely to continue. While SP500-20103010 is showing intraday weakness, it remains in the confines of a bullish trend. Traders should use caution and utilize a stop order.
Is it time to buy, sell, or avoid SP500-20103010?
MarketClub looks at technical strength and momentum to determine if the timing is right for SP500-20103010.
Learn more about the Trade Triangles and how we make technical analysis as easy as buy and sell.
|
|||||||||||||||
|
|||||||||||||||
MarketClub’s Trade Triangles for SP500-20103010
![]() The long-term trend has been UP since May 1st, 2025 at 1659.09
The long-term trend has been UP since May 1st, 2025 at 1659.09
![]() The intermediate-term trend has been UP since Mar 23rd, 2026 at 2939.06
The intermediate-term trend has been UP since Mar 23rd, 2026 at 2939.06
![]() The short-term trend has been UP since Mar 23rd, 2026 at 2939.06
The short-term trend has been UP since Mar 23rd, 2026 at 2939.06
Smart Scan Analysis for SP500-20103010
Based on our trend formula, SP500-20103010 is rated as a +90 on a scale from -100 (Strong Downtrend) to +100 (Strong Uptrend).
| Open | High | Low | Price | Change |
|---|---|---|---|---|
| 2967.10 | 2973.37 | 2927.89 | 2934.05 | -4.43 |
| Prev. Close | Volume | Bid | Ask | Time |
| 2934.05 | 1529032 | 2026-03-25 16:44:44 |
| 52wk High | 307.73 | 52wk High Date | 2018-01-29 |
| 52wk Low | 241.41 | 52wk Low Date | 2018-05-07 |