Index Trend Analysis Report
Prepared for you on Sunday, May 11, 2025.
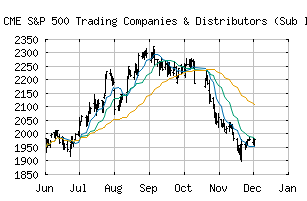
S&P 500 Trading Companies & Distributors (Sub Ind) (CME:SP500-20107010)
Countertrend Up (+85) - SP500-20107010 is showing short-term weakness. However, look for the longer-term bullish trend to resume. As always, continue to monitor the trend score and utilize a stop order.
Is it time to buy, sell, or avoid SP500-20107010?
MarketClub looks at technical strength and momentum to determine if the timing is right for SP500-20107010.
Learn more about the Trade Triangles and how we make technical analysis as easy as buy and sell.
|
|||||||||||||||
|
|||||||||||||||
MarketClub’s Trade Triangles for SP500-20107010
![]() The long-term trend has been UP since May 5th, 2025 at 1938.86
The long-term trend has been UP since May 5th, 2025 at 1938.86
![]() The intermediate-term trend has been UP since Apr 23rd, 2025 at 1840.43
The intermediate-term trend has been UP since Apr 23rd, 2025 at 1840.43
![]() The short-term trend has been DOWN since May 6th, 2025 at 1868.36
The short-term trend has been DOWN since May 6th, 2025 at 1868.36
Smart Scan Analysis for SP500-20107010
Based on our trend formula, SP500-20107010 is rated as a +85 on a scale from -100 (Strong Downtrend) to +100 (Strong Uptrend).
| Open | High | Low | Price | Change |
|---|---|---|---|---|
| 1895.46 | 1902.96 | 1875.08 | 1885.93 | -8.81 |
| Prev. Close | Volume | Bid | Ask | Time |
| 1885.93 | 2786830 | 2025-05-09 16:20:08 |
| 52wk High | 616.7 | 52wk High Date | 2018-08-21 |
| 52wk Low | 452.75 | 52wk Low Date | 2018-10-26 |