Index Trend Analysis Report
Prepared for you on Monday, May 12, 2025.
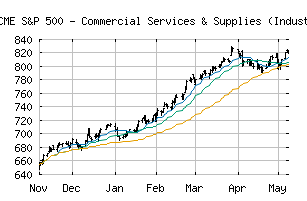
S&P 500 - Commercial Services & Supplies (Industry) (CME:SP500-202010)
Countertrend Up (+85) - SP500-202010 is showing short-term weakness. However, look for the longer-term bullish trend to resume. As always, continue to monitor the trend score and utilize a stop order.
Is it time to buy, sell, or avoid SP500-202010?
MarketClub looks at technical strength and momentum to determine if the timing is right for SP500-202010.
Learn more about the Trade Triangles and how we make technical analysis as easy as buy and sell.
|
|||||||||||||||
|
|||||||||||||||
MarketClub’s Trade Triangles for SP500-202010
![]() The long-term trend has been UP since Apr 1st, 2025 at 931.74
The long-term trend has been UP since Apr 1st, 2025 at 931.74
![]() The intermediate-term trend has been UP since Apr 30th, 2025 at 943.31
The intermediate-term trend has been UP since Apr 30th, 2025 at 943.31
![]() The short-term trend has been DOWN since May 12th, 2025 at 952.98
The short-term trend has been DOWN since May 12th, 2025 at 952.98
Smart Scan Analysis for SP500-202010
Based on our trend formula, SP500-202010 is rated as a +85 on a scale from -100 (Strong Downtrend) to +100 (Strong Uptrend).
| Open | High | Low | Price | Change |
|---|---|---|---|---|
| 959.71 | 959.71 | 935.94 | 949.43 | -6.95 |
| Prev. Close | Volume | Bid | Ask | Time |
| 956.38 | 14369569 | 2025-05-12 16:47:21 |
| 52wk High | 321.81 | 52wk High Date | 2018-09-11 |
| 52wk Low | 260.6 | 52wk Low Date | 2018-02-09 |