Index Trend Analysis Report
Prepared for you on Saturday, March 21, 2026.
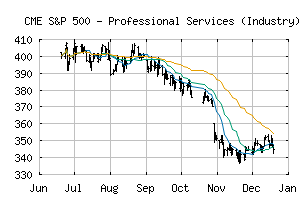
S&P 500 - Professional Services (Industry) (CME:SP500-202020)
Bear Market Rally (-75) - SP500-202020 is showing some rallying power, but still remains in the confines of a long-term downtrend. Keep an eye on SP500-202020 as it may be in the beginning of a reversal.
Is it time to buy, sell, or avoid SP500-202020?
MarketClub looks at technical strength and momentum to determine if the timing is right for SP500-202020.
Learn more about the Trade Triangles and how we make technical analysis as easy as buy and sell.
|
|||||||||||||||
|
|||||||||||||||
MarketClub’s Trade Triangles for SP500-202020
![]() The long-term trend has been DOWN since Sep 10th, 2025 at 388.41
The long-term trend has been DOWN since Sep 10th, 2025 at 388.41
![]() The intermediate-term trend has been UP since Mar 5th, 2026 at 311.53
The intermediate-term trend has been UP since Mar 5th, 2026 at 311.53
![]() The short-term trend has been DOWN since Mar 10th, 2026 at 306.85
The short-term trend has been DOWN since Mar 10th, 2026 at 306.85
Smart Scan Analysis for SP500-202020
Based on our trend formula, SP500-202020 is rated as a -75 on a scale from -100 (Strong Downtrend) to +100 (Strong Uptrend).
| Open | High | Low | Price | Change |
|---|---|---|---|---|
| 290.90 | 292.70 | 289.55 | 289.83 | -1.11 |
| Prev. Close | Volume | Bid | Ask | Time |
| 289.83 | 60762623 | 2026-03-20 16:19:49 |
| 52wk High | 198.32 | 52wk High Date | 2018-09-18 |
| 52wk Low | 162.68 | 52wk Low Date | 2018-02-09 |