Index Trend Analysis Report
Prepared for you on Thursday, March 19, 2026.
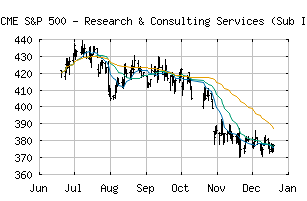
S&P 500 - Research & Consulting Services (Sub Ind) (CME:SP500-20202020)
Long-Term Downtrend (-90) - SP500-20202020 is in a strong downtrend that is likely to continue. While SP500-20202020 is showing intraday strength, it remains in the confines of a bearish trend. Traders should use caution and set stops.
Is it time to buy, sell, or avoid SP500-20202020?
MarketClub looks at technical strength and momentum to determine if the timing is right for SP500-20202020.
Learn more about the Trade Triangles and how we make technical analysis as easy as buy and sell.
|
|||||||||||||||
|
|||||||||||||||
MarketClub’s Trade Triangles for SP500-20202020
![]() The long-term trend has been DOWN since Aug 1st, 2025 at 406.38
The long-term trend has been DOWN since Aug 1st, 2025 at 406.38
![]() The intermediate-term trend has been DOWN since Mar 19th, 2026 at 334.66
The intermediate-term trend has been DOWN since Mar 19th, 2026 at 334.66
![]() The short-term trend has been DOWN since Mar 6th, 2026 at 360.51
The short-term trend has been DOWN since Mar 6th, 2026 at 360.51
Smart Scan Analysis for SP500-20202020
Based on our trend formula, SP500-20202020 is rated as a -90 on a scale from -100 (Strong Downtrend) to +100 (Strong Uptrend).
| Open | High | Low | Price | Change |
|---|---|---|---|---|
| 338.32 | 343.12 | 334.43 | 337.57 | -2.85 |
| Prev. Close | Volume | Bid | Ask | Time |
| 340.42 | 5563740 | 2026-03-19 16:19:02 |
| 52wk High | 185.21 | 52wk High Date | 2018-09-18 |
| 52wk Low | 154.65 | 52wk Low Date | 2018-02-09 |