Index Trend Analysis Report
Prepared for you on Friday, July 26, 2024.
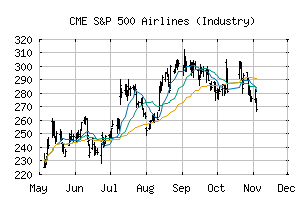
S&P 500 Airlines (Industry) (CME:SP500-203020)
Long-Term Downtrend (-90) - SP500-203020 is in a strong downtrend that is likely to continue. While SP500-203020 is showing intraday strength, it remains in the confines of a bearish trend. Traders should use caution and set stops.
Is it time to buy, sell, or avoid SP500-203020?
MarketClub looks at technical strength and momentum to determine if the timing is right for SP500-203020.
Learn more about the Trade Triangles and how we make technical analysis as easy as buy and sell.
|
|||||||||||||||
|
|||||||||||||||
MarketClub’s Trade Triangles for SP500-203020
![]() The long-term trend has been DOWN since Jul 11th, 2024 at 194.78
The long-term trend has been DOWN since Jul 11th, 2024 at 194.78
![]() The intermediate-term trend has been DOWN since May 28th, 2024 at 214.84
The intermediate-term trend has been DOWN since May 28th, 2024 at 214.84
![]() The short-term trend has been DOWN since Jul 24th, 2024 at 190.91
The short-term trend has been DOWN since Jul 24th, 2024 at 190.91
Smart Scan Analysis for SP500-203020
Based on our trend formula, SP500-203020 is rated as a -90 on a scale from -100 (Strong Downtrend) to +100 (Strong Uptrend).
| Open | High | Low | Price | Change |
|---|---|---|---|---|
| 195.60 | 195.60 | 191.12 | 194.05 | +0.42 |
| Prev. Close | Volume | Bid | Ask | Time |
| 193.63 | 73124604 | 2024-07-26 16:20:03 |
| 52wk High | 393.95 | 52wk High Date | 2018-01-16 |
| 52wk Low | 303.4 | 52wk Low Date | 2018-06-28 |