Index Trend Analysis Report
Prepared for you on Sunday, March 29, 2026.
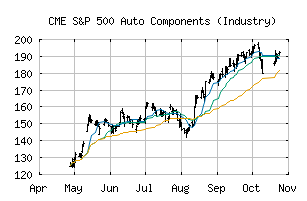
S&P 500 Auto Components (Industry) (CME:SP500-251010)
Strong Downtrend (-100) - SP500-251010 is in a strong downtrend that is likely to continue. With short-term, intermediate, and long-term bearish momentum, SP500-251010 continues to fall. Traders should use caution and set stops.
Is it time to buy, sell, or avoid SP500-251010?
MarketClub looks at technical strength and momentum to determine if the timing is right for SP500-251010.
Learn more about the Trade Triangles and how we make technical analysis as easy as buy and sell.
|
|||||||||||||||
|
|||||||||||||||
MarketClub’s Trade Triangles for SP500-251010
![]() The long-term trend has been DOWN since Mar 2nd, 2026 at 163.57
The long-term trend has been DOWN since Mar 2nd, 2026 at 163.57
![]() The intermediate-term trend has been DOWN since Feb 27th, 2026 at 166.46
The intermediate-term trend has been DOWN since Feb 27th, 2026 at 166.46
![]() The short-term trend has been DOWN since Mar 27th, 2026 at 156.24
The short-term trend has been DOWN since Mar 27th, 2026 at 156.24
Smart Scan Analysis for SP500-251010
Based on our trend formula, SP500-251010 is rated as a -100 on a scale from -100 (Strong Downtrend) to +100 (Strong Uptrend).
| Open | High | Low | Price | Change |
|---|---|---|---|---|
| 156.60 | 156.82 | 149.39 | 149.57 | -8.72 |
| Prev. Close | Volume | Bid | Ask | Time |
| 149.57 | 2758308 | 2026-03-27 16:31:13 |
| 52wk High | 235.48 | 52wk High Date | 2018-01-29 |
| 52wk Low | 160.54 | 52wk Low Date | 2018-10-23 |