Index Trend Analysis Report
Prepared for you on Saturday, April 4, 2026.
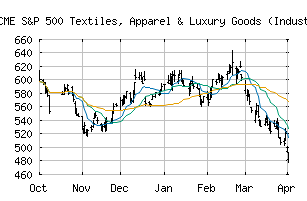
S&P 500 Textiles, Apparel & Luxury Goods (Industry) (CME:SP500-252030)
Long-Term Downtrend (-90) - SP500-252030 is in a strong downtrend that is likely to continue. While SP500-252030 is showing intraday strength, it remains in the confines of a bearish trend. Traders should use caution and set stops.
Is it time to buy, sell, or avoid SP500-252030?
MarketClub looks at technical strength and momentum to determine if the timing is right for SP500-252030.
Learn more about the Trade Triangles and how we make technical analysis as easy as buy and sell.
|
|||||||||||||||
|
|||||||||||||||
MarketClub’s Trade Triangles for SP500-252030
![]() The long-term trend has been DOWN since Mar 6th, 2026 at 555.12
The long-term trend has been DOWN since Mar 6th, 2026 at 555.12
![]() The intermediate-term trend has been DOWN since Mar 2nd, 2026 at 587.01
The intermediate-term trend has been DOWN since Mar 2nd, 2026 at 587.01
![]() The short-term trend has been DOWN since Mar 26th, 2026 at 527.11
The short-term trend has been DOWN since Mar 26th, 2026 at 527.11
Smart Scan Analysis for SP500-252030
Based on our trend formula, SP500-252030 is rated as a -90 on a scale from -100 (Strong Downtrend) to +100 (Strong Uptrend).
| Open | High | Low | Price | Change |
|---|---|---|---|---|
| 481.94 | 492.24 | 478.37 | 485.32 | -7.95 |
| Prev. Close | Volume | Bid | Ask | Time |
| 485.32 | 68376524 | 2026-04-02 16:19:08 |
| 52wk High | 914.48 | 52wk High Date | 2018-10-01 |
| 52wk Low | 677.23 | 52wk Low Date | 2017-12-01 |