Index Trend Analysis Report
Prepared for you on Saturday, March 28, 2026.
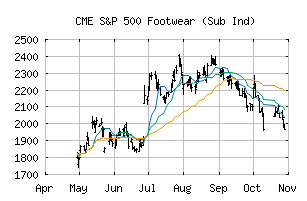
S&P 500 Footwear (Sub Ind) (CME:SP500-25203020)
Strong Downtrend (-100) - SP500-25203020 is in a strong downtrend that is likely to continue. With short-term, intermediate, and long-term bearish momentum, SP500-25203020 continues to fall. Traders should use caution and set stops.
Is it time to buy, sell, or avoid SP500-25203020?
MarketClub looks at technical strength and momentum to determine if the timing is right for SP500-25203020.
Learn more about the Trade Triangles and how we make technical analysis as easy as buy and sell.
|
|||||||||||||||
|
|||||||||||||||
MarketClub’s Trade Triangles for SP500-25203020
![]() The long-term trend has been DOWN since Mar 9th, 2026 at 1771.87
The long-term trend has been DOWN since Mar 9th, 2026 at 1771.87
![]() The intermediate-term trend has been DOWN since Mar 2nd, 2026 at 1918.84
The intermediate-term trend has been DOWN since Mar 2nd, 2026 at 1918.84
![]() The short-term trend has been DOWN since Mar 26th, 2026 at 1656.58
The short-term trend has been DOWN since Mar 26th, 2026 at 1656.58
Smart Scan Analysis for SP500-25203020
Based on our trend formula, SP500-25203020 is rated as a -100 on a scale from -100 (Strong Downtrend) to +100 (Strong Uptrend).
| Open | High | Low | Price | Change |
|---|---|---|---|---|
| 1625.65 | 1630.98 | 1604.45 | 1609.70 | -16.90 |
| Prev. Close | Volume | Bid | Ask | Time |
| 1609.70 | 14883296 | 2026-03-27 16:31:13 |
| 52wk High | 2612.18 | 52wk High Date | 2018-09-21 |
| 52wk Low | 1801.38 | 52wk Low Date | 2017-12-01 |