Index Trend Analysis Report
Prepared for you on Tuesday, March 24, 2026.
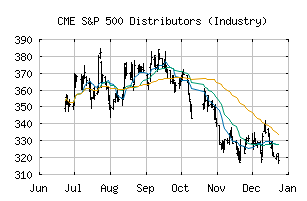
S&P 500 Distributors (Industry) (CME:SP500-255010)
Countertrend Down (-85) - SP500-255010 is showing short-term strength. However, look for the longer-term bearish trend to resume. As always, continue to monitor the trend score and set stops.
Is it time to buy, sell, or avoid SP500-255010?
MarketClub looks at technical strength and momentum to determine if the timing is right for SP500-255010.
Learn more about the Trade Triangles and how we make technical analysis as easy as buy and sell.
|
|||||||||||||||
|
|||||||||||||||
MarketClub’s Trade Triangles for SP500-255010
![]() The long-term trend has been DOWN since Feb 19th, 2026 at 312.82
The long-term trend has been DOWN since Feb 19th, 2026 at 312.82
![]() The intermediate-term trend has been DOWN since Feb 17th, 2026 at 348.45
The intermediate-term trend has been DOWN since Feb 17th, 2026 at 348.45
![]() The short-term trend has been UP since Mar 24th, 2026 at 269.00
The short-term trend has been UP since Mar 24th, 2026 at 269.00
Smart Scan Analysis for SP500-255010
Based on our trend formula, SP500-255010 is rated as a -85 on a scale from -100 (Strong Downtrend) to +100 (Strong Uptrend).
| Open | High | Low | Price | Change |
|---|---|---|---|---|
| 262.60 | 270.17 | 261.55 | 268.77 | +2.63 |
| Prev. Close | Volume | Bid | Ask | Time |
| 266.14 | 2748027 | 2026-03-24 16:19:38 |
| 52wk High | 396.79 | 52wk High Date | 2018-01-29 |
| 52wk Low | 298.51 | 52wk Low Date | 2018-05-01 |