Index Trend Analysis Report
Prepared for you on Wednesday, April 1, 2026.
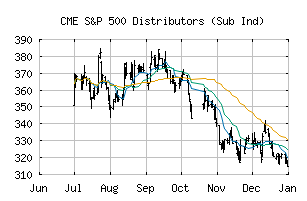
S&P 500 Distributors (Sub Ind) (CME:SP500-25501010)
Bear Market Rally (-75) - SP500-25501010 is showing some rallying power, but still remains in the confines of a long-term downtrend. Keep an eye on SP500-25501010 as it may be in the beginning of a reversal.
Is it time to buy, sell, or avoid SP500-25501010?
MarketClub looks at technical strength and momentum to determine if the timing is right for SP500-25501010.
Learn more about the Trade Triangles and how we make technical analysis as easy as buy and sell.
|
|||||||||||||||
|
|||||||||||||||
MarketClub’s Trade Triangles for SP500-25501010
![]() The long-term trend has been DOWN since Feb 19th, 2026 at 312.82
The long-term trend has been DOWN since Feb 19th, 2026 at 312.82
![]() The intermediate-term trend has been DOWN since Feb 17th, 2026 at 348.45
The intermediate-term trend has been DOWN since Feb 17th, 2026 at 348.45
![]() The short-term trend has been UP since Mar 31st, 2026 at 275.50
The short-term trend has been UP since Mar 31st, 2026 at 275.50
Smart Scan Analysis for SP500-25501010
Based on our trend formula, SP500-25501010 is rated as a -75 on a scale from -100 (Strong Downtrend) to +100 (Strong Uptrend).
| Open | High | Low | Price | Change |
|---|---|---|---|---|
| 273.86 | 275.76 | 269.14 | 273.26 | +3.26 |
| Prev. Close | Volume | Bid | Ask | Time |
| 273.26 | 2962517 | 2026-03-31 16:19:38 |
| 52wk High | 396.79 | 52wk High Date | 2018-01-29 |
| 52wk Low | 298.51 | 52wk Low Date | 2018-05-01 |