Index Trend Analysis Report
Prepared for you on Tuesday, June 17, 2025.
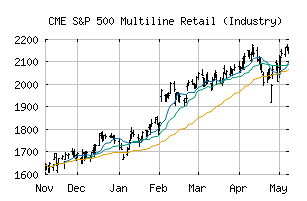
S&P 500 Multiline Retail (Industry) (CME:SP500-255030)
Countertrend Up (+85) - SP500-255030 is showing short-term weakness. However, look for the longer-term bullish trend to resume. As always, continue to monitor the trend score and utilize a stop order.
Is it time to buy, sell, or avoid SP500-255030?
MarketClub looks at technical strength and momentum to determine if the timing is right for SP500-255030.
Learn more about the Trade Triangles and how we make technical analysis as easy as buy and sell.
|
|||||||||||||||
|
|||||||||||||||
MarketClub’s Trade Triangles for SP500-255030
![]() The long-term trend has been UP since Jun 9th, 2025 at 2471.59
The long-term trend has been UP since Jun 9th, 2025 at 2471.59
![]() The intermediate-term trend has been UP since May 2nd, 2025 at 2210.92
The intermediate-term trend has been UP since May 2nd, 2025 at 2210.92
![]() The short-term trend has been DOWN since Jun 12th, 2025 at 2454.61
The short-term trend has been DOWN since Jun 12th, 2025 at 2454.61
Smart Scan Analysis for SP500-255030
Based on our trend formula, SP500-255030 is rated as a +85 on a scale from -100 (Strong Downtrend) to +100 (Strong Uptrend).
| Open | High | Low | Price | Change |
|---|---|---|---|---|
| 2450.78 | 2500.68 | 2441.41 | 2490.47 | +45.48 |
| Prev. Close | Volume | Bid | Ask | Time |
| 2444.99 | 37911267 | 2025-06-16 16:19:38 |
| 52wk High | 843.64 | 52wk High Date | 2018-11-08 |
| 52wk Low | 628.86 | 52wk Low Date | 2017-12-01 |