Index Trend Analysis Report
Prepared for you on Thursday, March 12, 2026.
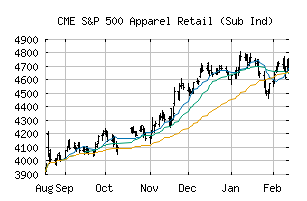
S&P 500 Apparel Retail (Sub Ind) (CME:SP500-25504010)
Bull Market Weakness (+75) - SP500-25504010 is showing signs of short-term weakness, but still remains in the confines of a long-term uptrend. Keep an eye on SP500-25504010 as it may be in the beginning stages of a reversal.
Is it time to buy, sell, or avoid SP500-25504010?
MarketClub looks at technical strength and momentum to determine if the timing is right for SP500-25504010.
Learn more about the Trade Triangles and how we make technical analysis as easy as buy and sell.
|
|||||||||||||||
|
|||||||||||||||
MarketClub’s Trade Triangles for SP500-25504010
![]() The long-term trend has been UP since Apr 14th, 2025 at 3823.03
The long-term trend has been UP since Apr 14th, 2025 at 3823.03
![]() The intermediate-term trend has been UP since Feb 10th, 2026 at 4760.91
The intermediate-term trend has been UP since Feb 10th, 2026 at 4760.91
![]() The short-term trend has been UP since Mar 10th, 2026 at 4994.80
The short-term trend has been UP since Mar 10th, 2026 at 4994.80
Smart Scan Analysis for SP500-25504010
Based on our trend formula, SP500-25504010 is rated as a +70 on a scale from -100 (Strong Downtrend) to +100 (Strong Uptrend).
| Open | High | Low | Price | Change |
|---|---|---|---|---|
| 4877.39 | 4918.95 | 4844.92 | 4846.53 | -66.42 |
| Prev. Close | Volume | Bid | Ask | Time |
| 4912.95 | 5942498 | 2026-03-12 16:20:04 |
| 52wk High | 1860.12 | 52wk High Date | 2018-11-12 |
| 52wk Low | 1376.07 | 52wk Low Date | 2018-02-06 |