Index Trend Analysis Report
Prepared for you on Friday, April 3, 2026.
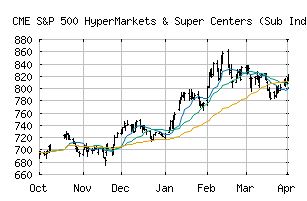
S&P 500 HyperMarkets & Super Centers (Sub Ind) (CME:SP500-30101040)
Bull Market Weakness (+75) - SP500-30101040 is showing signs of short-term weakness, but still remains in the confines of a long-term uptrend. Keep an eye on SP500-30101040 as it may be in the beginning stages of a reversal.
Is it time to buy, sell, or avoid SP500-30101040?
MarketClub looks at technical strength and momentum to determine if the timing is right for SP500-30101040.
Learn more about the Trade Triangles and how we make technical analysis as easy as buy and sell.
|
|||||||||||||||
|
|||||||||||||||
MarketClub’s Trade Triangles for SP500-30101040
![]() The long-term trend has been UP since Dec 1st, 2025 at 729.98
The long-term trend has been UP since Dec 1st, 2025 at 729.98
![]() The intermediate-term trend has been DOWN since Mar 6th, 2026 at 801.34
The intermediate-term trend has been DOWN since Mar 6th, 2026 at 801.34
![]() The short-term trend has been UP since Mar 24th, 2026 at 801.43
The short-term trend has been UP since Mar 24th, 2026 at 801.43
Smart Scan Analysis for SP500-30101040
Based on our trend formula, SP500-30101040 is rated as a +75 on a scale from -100 (Strong Downtrend) to +100 (Strong Uptrend).
| Open | High | Low | Price | Change |
|---|---|---|---|---|
| 818.68 | 822.50 | 812.15 | 822.44 | +9.91 |
| Prev. Close | Volume | Bid | Ask | Time |
| 822.44 | 23501972 | 2026-04-02 16:19:08 |
| 52wk High | 256.62 | 52wk High Date | 2018-11-12 |
| 52wk Low | 201 | 52wk Low Date | 2018-04-02 |