Index Trend Analysis Report
Prepared for you on Saturday, March 28, 2026.
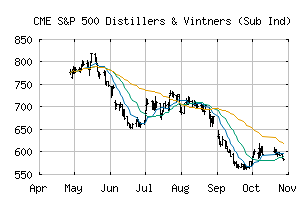
S&P 500 Distillers & Vintners (Sub Ind) (CME:SP500-30201020)
Weak Uptrend (+65) - SP500-30201020 is showing signs of weakening momentum to the upside. Monitor SP500-30201020 as it may be in the beginning stages of a reversal.
Is it time to buy, sell, or avoid SP500-30201020?
MarketClub looks at technical strength and momentum to determine if the timing is right for SP500-30201020.
Learn more about the Trade Triangles and how we make technical analysis as easy as buy and sell.
|
|||||||||||||||
|
|||||||||||||||
MarketClub’s Trade Triangles for SP500-30201020
![]() The long-term trend has been UP since Jan 14th, 2026 at 646.95
The long-term trend has been UP since Jan 14th, 2026 at 646.95
![]() The intermediate-term trend has been DOWN since Feb 18th, 2026 at 631.57
The intermediate-term trend has been DOWN since Feb 18th, 2026 at 631.57
![]() The short-term trend has been UP since Mar 23rd, 2026 at 620.67
The short-term trend has been UP since Mar 23rd, 2026 at 620.67
Smart Scan Analysis for SP500-30201020
Based on our trend formula, SP500-30201020 is rated as a +65 on a scale from -100 (Strong Downtrend) to +100 (Strong Uptrend).
| Open | High | Low | Price | Change |
|---|---|---|---|---|
| 620.79 | 636.73 | 618.38 | 629.52 | +9.40 |
| Prev. Close | Volume | Bid | Ask | Time |
| 629.52 | 15033748 | 2026-03-27 16:31:13 |
| 52wk High | 1044.41 | 52wk High Date | 2018-04-30 |
| 52wk Low | 835.02 | 52wk Low Date | 2018-11-20 |