Index Trend Analysis Report
Prepared for you on Saturday, April 4, 2026.
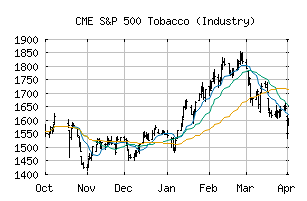
S&P 500 Tobacco (Industry) (CME:SP500-302030)
Weak Downtrend (-65) - SP500-302030 is showing signs of a strengthening downtrend. Monitor SP500-302030 as it may be building momentum to the downside.
Is it time to buy, sell, or avoid SP500-302030?
MarketClub looks at technical strength and momentum to determine if the timing is right for SP500-302030.
Learn more about the Trade Triangles and how we make technical analysis as easy as buy and sell.
|
|||||||||||||||
|
|||||||||||||||
MarketClub’s Trade Triangles for SP500-302030
![]() The long-term trend has been UP since Jan 14th, 2026 at 1638.59
The long-term trend has been UP since Jan 14th, 2026 at 1638.59
![]() The intermediate-term trend has been DOWN since Mar 5th, 2026 at 1723.03
The intermediate-term trend has been DOWN since Mar 5th, 2026 at 1723.03
![]() The short-term trend has been DOWN since Apr 1st, 2026 at 1618.53
The short-term trend has been DOWN since Apr 1st, 2026 at 1618.53
Smart Scan Analysis for SP500-302030
Based on our trend formula, SP500-302030 is rated as a -70 on a scale from -100 (Strong Downtrend) to +100 (Strong Uptrend).
| Open | High | Low | Price | Change |
|---|---|---|---|---|
| 1591.41 | 1609.15 | 1580.26 | 1593.12 | +7.45 |
| Prev. Close | Volume | Bid | Ask | Time |
| 1593.12 | 13847810 | 2026-04-02 16:19:08 |
| 52wk High | 1328.62 | 52wk High Date | 2017-12-19 |
| 52wk Low | 960.09 | 52wk Low Date | 2018-07-19 |