Index Trend Analysis Report
Prepared for you on Thursday, March 12, 2026.
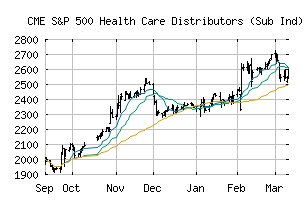
S&P 500 Health Care Distributors (Sub Ind) (CME:SP500-35102010)
Crossroads (-60) - SP500-35102010 is struggling to move into a solid trend. Beware of choppy markets and consider a sidelines position until a stronger trend is identified.
Is it time to buy, sell, or avoid SP500-35102010?
MarketClub looks at technical strength and momentum to determine if the timing is right for SP500-35102010.
Learn more about the Trade Triangles and how we make technical analysis as easy as buy and sell.
|
|||||||||||||||
|
|||||||||||||||
MarketClub’s Trade Triangles for SP500-35102010
![]() The long-term trend has been UP since Sep 24th, 2025 at 2072.02
The long-term trend has been UP since Sep 24th, 2025 at 2072.02
![]() The intermediate-term trend has been DOWN since Mar 11th, 2026 at 2518.36
The intermediate-term trend has been DOWN since Mar 11th, 2026 at 2518.36
![]() The short-term trend has been DOWN since Mar 3rd, 2026 at 2641.07
The short-term trend has been DOWN since Mar 3rd, 2026 at 2641.07
Smart Scan Analysis for SP500-35102010
Based on our trend formula, SP500-35102010 is rated as a -60 on a scale from -100 (Strong Downtrend) to +100 (Strong Uptrend).
| Open | High | Low | Price | Change |
|---|---|---|---|---|
| 2548.14 | 2582.61 | 2537.64 | 2573.07 | +29.92 |
| Prev. Close | Volume | Bid | Ask | Time |
| 2543.15 | 828125 | 2026-03-12 10:34:23 |
| 52wk High | 708.21 | 52wk High Date | 2018-01-29 |
| 52wk Low | 509.46 | 52wk Low Date | 2018-10-26 |