Index Trend Analysis Report
Prepared for you on Thursday, April 25, 2024.
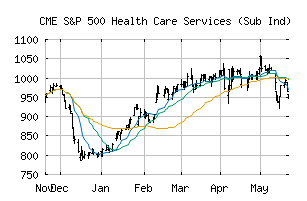
S&P 500 Health Care Services (Sub Ind) (CME:SP500-35102015)
Sidelines Mode (-55) - SP500-35102015 is moving in a sideways pattern and is unable to gain momentum in either direction. Beware of choppy movement and consider a sidelines position until a stronger trend is identified.
Is it time to buy, sell, or avoid SP500-35102015?
MarketClub looks at technical strength and momentum to determine if the timing is right for SP500-35102015.
Learn more about the Trade Triangles and how we make technical analysis as easy as buy and sell.
|
|||||||||||||||
|
|||||||||||||||
MarketClub’s Trade Triangles for SP500-35102015
![]() The long-term trend has been UP since Jul 18th, 2023 at 949.06
The long-term trend has been UP since Jul 18th, 2023 at 949.06
![]() The intermediate-term trend has been DOWN since Apr 9th, 2024 at 1044.86
The intermediate-term trend has been DOWN since Apr 9th, 2024 at 1044.86
![]() The short-term trend has been UP since Apr 22nd, 2024 at 1014.02
The short-term trend has been UP since Apr 22nd, 2024 at 1014.02
Smart Scan Analysis for SP500-35102015
Based on our trend formula, SP500-35102015 is rated as a -55 on a scale from -100 (Strong Downtrend) to +100 (Strong Uptrend).
| Open | High | Low | Price | Change |
|---|---|---|---|---|
| 1006.92 | 1012.85 | 1006.04 | 1010.32 | -4.42 |
| Prev. Close | Volume | Bid | Ask | Time |
| 1010.32 | 12600854 | 2024-04-24 17:07:32 |
| 52wk High | 825.07 | 52wk High Date | 2018-11-07 |
| 52wk Low | 618.98 | 52wk Low Date | 2017-11-30 |