Index Trend Analysis Report
Prepared for you on Friday, March 20, 2026.
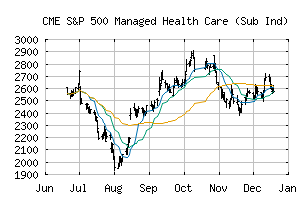
S&P 500 Managed Health Care (Sub Ind) (CME:SP500-35102030)
Strong Downtrend (-100) - SP500-35102030 is in a strong downtrend that is likely to continue. With short-term, intermediate, and long-term bearish momentum, SP500-35102030 continues to fall. Traders should use caution and set stops.
Is it time to buy, sell, or avoid SP500-35102030?
MarketClub looks at technical strength and momentum to determine if the timing is right for SP500-35102030.
Learn more about the Trade Triangles and how we make technical analysis as easy as buy and sell.
|
|||||||||||||||
|
|||||||||||||||
MarketClub’s Trade Triangles for SP500-35102030
![]() The long-term trend has been DOWN since Jan 27th, 2026 at 2380.93
The long-term trend has been DOWN since Jan 27th, 2026 at 2380.93
![]() The intermediate-term trend has been DOWN since Jan 27th, 2026 at 2645.45
The intermediate-term trend has been DOWN since Jan 27th, 2026 at 2645.45
![]() The short-term trend has been DOWN since Mar 19th, 2026 at 2177.89
The short-term trend has been DOWN since Mar 19th, 2026 at 2177.89
Smart Scan Analysis for SP500-35102030
Based on our trend formula, SP500-35102030 is rated as a -100 on a scale from -100 (Strong Downtrend) to +100 (Strong Uptrend).
| Open | High | Low | Price | Change |
|---|---|---|---|---|
| 2161.04 | 2187.85 | 2143.82 | 2143.85 | -27.51 |
| Prev. Close | Volume | Bid | Ask | Time |
| 2171.36 | 70383560 | 2026-03-20 16:19:38 |
| 52wk High | 2429.17 | 52wk High Date | 2018-11-29 |
| 52wk Low | 1834.25 | 52wk Low Date | 2018-03-23 |