Index Trend Analysis Report
Prepared for you on Tuesday, March 24, 2026.
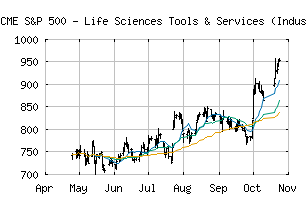
S&P 500 - Life Sciences Tools & Services (Industry) (CME:SP500-352030)
Bear Market Rally (-75) - SP500-352030 is showing some rallying power, but still remains in the confines of a long-term downtrend. Keep an eye on SP500-352030 as it may be in the beginning of a reversal.
Is it time to buy, sell, or avoid SP500-352030?
MarketClub looks at technical strength and momentum to determine if the timing is right for SP500-352030.
Learn more about the Trade Triangles and how we make technical analysis as easy as buy and sell.
|
|||||||||||||||
|
|||||||||||||||
MarketClub’s Trade Triangles for SP500-352030
![]() The long-term trend has been DOWN since Feb 5th, 2026 at 910.25
The long-term trend has been DOWN since Feb 5th, 2026 at 910.25
![]() The intermediate-term trend has been DOWN since Jan 29th, 2026 at 965.82
The intermediate-term trend has been DOWN since Jan 29th, 2026 at 965.82
![]() The short-term trend has been UP since Mar 23rd, 2026 at 787.67
The short-term trend has been UP since Mar 23rd, 2026 at 787.67
Smart Scan Analysis for SP500-352030
Based on our trend formula, SP500-352030 is rated as a -75 on a scale from -100 (Strong Downtrend) to +100 (Strong Uptrend).
| Open | High | Low | Price | Change |
|---|---|---|---|---|
| 778.33 | 800.03 | 776.28 | 799.70 | +10.29 |
| Prev. Close | Volume | Bid | Ask | Time |
| 789.41 | 3390487 | 2026-03-24 12:19:03 |
| 52wk High | 594.57 | 52wk High Date | 2018-10-01 |
| 52wk Low | 443.98 | 52wk Low Date | 2017-12-06 |