Index Trend Analysis Report
Prepared for you on Thursday, March 26, 2026.
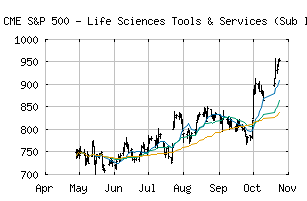
S&P 500 - Life Sciences Tools & Services (Sub Ind) (CME:SP500-35203010)
Countertrend Down (-85) - SP500-35203010 is showing short-term strength. However, look for the longer-term bearish trend to resume. As always, continue to monitor the trend score and set stops.
Is it time to buy, sell, or avoid SP500-35203010?
MarketClub looks at technical strength and momentum to determine if the timing is right for SP500-35203010.
Learn more about the Trade Triangles and how we make technical analysis as easy as buy and sell.
|
|||||||||||||||
|
|||||||||||||||
MarketClub’s Trade Triangles for SP500-35203010
![]() The long-term trend has been DOWN since Feb 5th, 2026 at 910.25
The long-term trend has been DOWN since Feb 5th, 2026 at 910.25
![]() The intermediate-term trend has been DOWN since Jan 29th, 2026 at 964.76
The intermediate-term trend has been DOWN since Jan 29th, 2026 at 964.76
![]() The short-term trend has been UP since Mar 23rd, 2026 at 787.70
The short-term trend has been UP since Mar 23rd, 2026 at 787.70
Smart Scan Analysis for SP500-35203010
Based on our trend formula, SP500-35203010 is rated as a -85 on a scale from -100 (Strong Downtrend) to +100 (Strong Uptrend).
| Open | High | Low | Price | Change |
|---|---|---|---|---|
| 792.59 | 806.90 | 792.59 | 798.17 | +0.86 |
| Prev. Close | Volume | Bid | Ask | Time |
| 797.31 | 13346021 | 2026-03-26 16:20:02 |
| 52wk High | 594.57 | 52wk High Date | 2018-10-01 |
| 52wk Low | 443.98 | 52wk Low Date | 2017-12-06 |