Index Trend Analysis Report
Prepared for you on Friday, October 31, 2025.
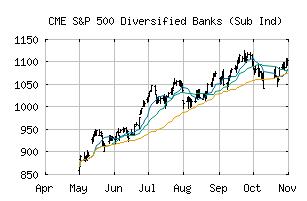
S&P 500 Diversified Banks (Sub Ind) (CME:SP500-40101010)
Strong Uptrend (+100) - SP500-40101010 is in a strong uptrend that is likely to continue. With short-term, intermediate, and long-term bullish momentum, SP500-40101010 continues to climb. Traders should protect gains and look for a change in score to suggest a slow down in momentum.
Is it time to buy, sell, or avoid SP500-40101010?
MarketClub looks at technical strength and momentum to determine if the timing is right for SP500-40101010.
Learn more about the Trade Triangles and how we make technical analysis as easy as buy and sell.
|
|||||||||||||||
|
|||||||||||||||
MarketClub’s Trade Triangles for SP500-40101010
![]() The long-term trend has been UP since Jun 23rd, 2025 at 970.86
The long-term trend has been UP since Jun 23rd, 2025 at 970.86
![]() The intermediate-term trend has been UP since Oct 27th, 2025 at 1093.43
The intermediate-term trend has been UP since Oct 27th, 2025 at 1093.43
![]() The short-term trend has been UP since Oct 20th, 2025 at 1078.02
The short-term trend has been UP since Oct 20th, 2025 at 1078.02
Smart Scan Analysis for SP500-40101010
Based on our trend formula, SP500-40101010 is rated as a +100 on a scale from -100 (Strong Downtrend) to +100 (Strong Uptrend).
| Open | High | Low | Price | Change |
|---|---|---|---|---|
| 1093.35 | 1107.46 | 1092.39 | 1106.33 | +9.17 |
| Prev. Close | Volume | Bid | Ask | Time |
| 1097.16 | 60460785 | 2025-10-31 15:37:53 |
| 52wk High | 638.47 | 52wk High Date | 2018-01-29 |
| 52wk Low | 521.93 | 52wk Low Date | 2018-10-26 |