Index Trend Analysis Report
Prepared for you on Wednesday, May 8, 2024.
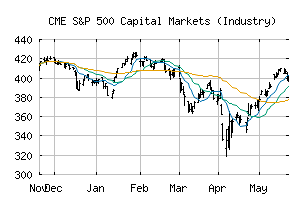
S&P 500 Capital Markets (Industry) (CME:SP500-402030)
Long-Term Uptrend (+90) - SP500-402030 is in a strong uptrend that is likely to continue. While SP500-402030 is showing intraday weakness, it remains in the confines of a bullish trend. Traders should use caution and utilize a stop order.
Is it time to buy, sell, or avoid SP500-402030?
MarketClub looks at technical strength and momentum to determine if the timing is right for SP500-402030.
Learn more about the Trade Triangles and how we make technical analysis as easy as buy and sell.
|
|||||||||||||||
|
|||||||||||||||
MarketClub’s Trade Triangles for SP500-402030
![]() The long-term trend has been UP since Dec 1st, 2023 at 291.21
The long-term trend has been UP since Dec 1st, 2023 at 291.21
![]() The intermediate-term trend has been UP since May 6th, 2024 at 320.35
The intermediate-term trend has been UP since May 6th, 2024 at 320.35
![]() The short-term trend has been UP since May 3rd, 2024 at 317.98
The short-term trend has been UP since May 3rd, 2024 at 317.98
Smart Scan Analysis for SP500-402030
Based on our trend formula, SP500-402030 is rated as a +90 on a scale from -100 (Strong Downtrend) to +100 (Strong Uptrend).
| Open | High | Low | Price | Change |
|---|---|---|---|---|
| 322.21 | 322.46 | 321.41 | 322.27 | -0.75 |
| Prev. Close | Volume | Bid | Ask | Time |
| 323.02 | 7534275 | 2024-05-08 10:57:08 |
| 52wk High | 222.34 | 52wk High Date | 2018-03-13 |
| 52wk Low | 175.01 | 52wk Low Date | 2018-10-26 |