Index Trend Analysis Report
Prepared for you on Monday, March 30, 2026.
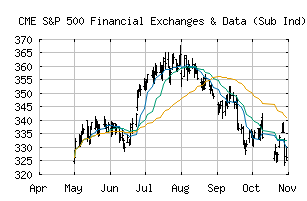
S&P 500 Financial Exchanges & Data (Sub Ind) (CME:SP500-40203040)
Long-Term Downtrend (-90) - SP500-40203040 is in a strong downtrend that is likely to continue. While SP500-40203040 is showing intraday strength, it remains in the confines of a bearish trend. Traders should use caution and set stops.
Is it time to buy, sell, or avoid SP500-40203040?
MarketClub looks at technical strength and momentum to determine if the timing is right for SP500-40203040.
Learn more about the Trade Triangles and how we make technical analysis as easy as buy and sell.
|
|||||||||||||||
|
|||||||||||||||
MarketClub’s Trade Triangles for SP500-40203040
![]() The long-term trend has been DOWN since Feb 3rd, 2026 at 317.24
The long-term trend has been DOWN since Feb 3rd, 2026 at 317.24
![]() The intermediate-term trend has been DOWN since Mar 24th, 2026 at 301.19
The intermediate-term trend has been DOWN since Mar 24th, 2026 at 301.19
![]() The short-term trend has been DOWN since Mar 19th, 2026 at 308.22
The short-term trend has been DOWN since Mar 19th, 2026 at 308.22
Smart Scan Analysis for SP500-40203040
Based on our trend formula, SP500-40203040 is rated as a -90 on a scale from -100 (Strong Downtrend) to +100 (Strong Uptrend).
| Open | High | Low | Price | Change |
|---|---|---|---|---|
| 294.07 | 298.43 | 293.33 | 297.12 | +6.07 |
| Prev. Close | Volume | Bid | Ask | Time |
| 291.05 | 23179721 | 2026-03-30 16:20:09 |
| 52wk High | 156.82 | 52wk High Date | 2018-07-26 |
| 52wk Low | 131.31 | 52wk Low Date | 2018-01-03 |