Index Trend Analysis Report
Prepared for you on Saturday, March 21, 2026.
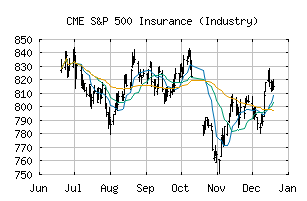
S&P 500 Insurance (Industry) (CME:SP500-403010)
Strong Downtrend (-100) - SP500-403010 is in a strong downtrend that is likely to continue. With short-term, intermediate, and long-term bearish momentum, SP500-403010 continues to fall. Traders should use caution and set stops.
Is it time to buy, sell, or avoid SP500-403010?
MarketClub looks at technical strength and momentum to determine if the timing is right for SP500-403010.
Learn more about the Trade Triangles and how we make technical analysis as easy as buy and sell.
|
|||||||||||||||
|
|||||||||||||||
MarketClub’s Trade Triangles for SP500-403010
![]() The long-term trend has been DOWN since Aug 1st, 2025 at 784.06
The long-term trend has been DOWN since Aug 1st, 2025 at 784.06
![]() The intermediate-term trend has been DOWN since Mar 9th, 2026 at 780.35
The intermediate-term trend has been DOWN since Mar 9th, 2026 at 780.35
![]() The short-term trend has been DOWN since Mar 18th, 2026 at 766.72
The short-term trend has been DOWN since Mar 18th, 2026 at 766.72
Smart Scan Analysis for SP500-403010
Based on our trend formula, SP500-403010 is rated as a -100 on a scale from -100 (Strong Downtrend) to +100 (Strong Uptrend).
| Open | High | Low | Price | Change |
|---|---|---|---|---|
| 757.78 | 766.35 | 757.78 | 763.60 | +6.67 |
| Prev. Close | Volume | Bid | Ask | Time |
| 763.60 | 98886132 | 2026-03-20 16:19:53 |
| 52wk High | 426.24 | 52wk High Date | 2018-01-29 |
| 52wk Low | 353.06 | 52wk Low Date | 2018-10-26 |