Index Trend Analysis Report
Prepared for you on Wednesday, March 12, 2025.
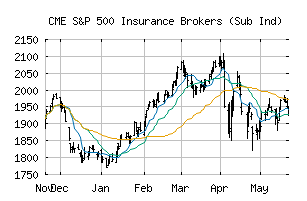
S&P 500 Insurance Brokers (Sub Ind) (CME:SP500-40301010)
Countertrend Up (+85) - SP500-40301010 is showing short-term weakness. However, look for the longer-term bullish trend to resume. As always, continue to monitor the trend score and utilize a stop order.
Is it time to buy, sell, or avoid SP500-40301010?
MarketClub looks at technical strength and momentum to determine if the timing is right for SP500-40301010.
Learn more about the Trade Triangles and how we make technical analysis as easy as buy and sell.
|
|||||||||||||||
|
|||||||||||||||
MarketClub’s Trade Triangles for SP500-40301010
![]() The long-term trend has been UP since Feb 13th, 2025 at 1989.70
The long-term trend has been UP since Feb 13th, 2025 at 1989.70
![]() The intermediate-term trend has been UP since Jan 15th, 2025 at 1835.66
The intermediate-term trend has been UP since Jan 15th, 2025 at 1835.66
![]() The short-term trend has been DOWN since Mar 6th, 2025 at 2040.01
The short-term trend has been DOWN since Mar 6th, 2025 at 2040.01
Smart Scan Analysis for SP500-40301010
Based on our trend formula, SP500-40301010 is rated as a +85 on a scale from -100 (Strong Downtrend) to +100 (Strong Uptrend).
| Open | High | Low | Price | Change |
|---|---|---|---|---|
| 2023.29 | 2026.26 | 2003.99 | 2015.49 | -7.86 |
| Prev. Close | Volume | Bid | Ask | Time |
| 2023.35 | 8838766 | 2025-03-11 16:19:53 |
| 52wk High | 739 | 52wk High Date | 2018-11-19 |
| 52wk Low | 629.13 | 52wk Low Date | 2018-01-02 |