Index Trend Analysis Report
Prepared for you on Saturday, April 4, 2026.
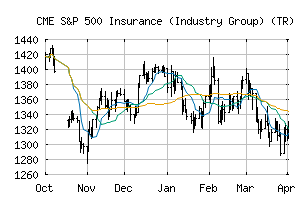
S&P 500 Insurance (Industry Group) (TR) (CME:SP500-4030TR)
Weak Downtrend (-65) - SP500-4030TR is showing signs of a strengthening downtrend. Monitor SP500-4030TR as it may be building momentum to the downside.
Is it time to buy, sell, or avoid SP500-4030TR?
MarketClub looks at technical strength and momentum to determine if the timing is right for SP500-4030TR.
Learn more about the Trade Triangles and how we make technical analysis as easy as buy and sell.
|
|||||||||||||||
|
|||||||||||||||
MarketClub’s Trade Triangles for SP500-4030TR
![]() The long-term trend has been DOWN since Mar 11th, 2026 at 1316.57
The long-term trend has been DOWN since Mar 11th, 2026 at 1316.57
![]() The intermediate-term trend has been DOWN since Mar 9th, 2026 at 1341.98
The intermediate-term trend has been DOWN since Mar 9th, 2026 at 1341.98
![]() The short-term trend has been UP since Mar 31st, 2026 at 1326.05
The short-term trend has been UP since Mar 31st, 2026 at 1326.05
Smart Scan Analysis for SP500-4030TR
Based on our trend formula, SP500-4030TR is rated as a -65 on a scale from -100 (Strong Downtrend) to +100 (Strong Uptrend).
| Open | High | Low | Price | Change |
|---|---|---|---|---|
| 1312.61 | 1330.27 | 1308.55 | 1322.76 | +10.26 |
| Prev. Close | Volume | Bid | Ask | Time |
| 1322.76 | 0 | 2026-04-02 16:19:05 |
| 52wk High | 614.11 | 52wk High Date | 2018-01-29 |
| 52wk Low | 517.45 | 52wk Low Date | 2018-10-26 |