Index Trend Analysis Report
Prepared for you on Thursday, May 29, 2025.
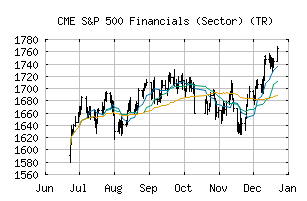
S&P 500 Financials (Sector) (TR) (CME:SP500-40TR)
Crossroads (+60) - SP500-40TR is struggling to move into a solid trend. Beware of choppy markets and consider a sidelines position until a stronger trend is identified.
Is it time to buy, sell, or avoid SP500-40TR?
MarketClub looks at technical strength and momentum to determine if the timing is right for SP500-40TR.
Learn more about the Trade Triangles and how we make technical analysis as easy as buy and sell.
|
|||||||||||||||
|
|||||||||||||||
MarketClub’s Trade Triangles for SP500-40TR
![]() The long-term trend has been DOWN since Apr 4th, 2025 at 1480.65
The long-term trend has been DOWN since Apr 4th, 2025 at 1480.65
![]() The intermediate-term trend has been UP since Apr 29th, 2025 at 1537.65
The intermediate-term trend has been UP since Apr 29th, 2025 at 1537.65
![]() The short-term trend has been UP since May 28th, 2025 at 1608.53
The short-term trend has been UP since May 28th, 2025 at 1608.53
Smart Scan Analysis for SP500-40TR
Based on our trend formula, SP500-40TR is rated as a +60 on a scale from -100 (Strong Downtrend) to +100 (Strong Uptrend).
| Open | High | Low | Price | Change |
|---|---|---|---|---|
| 1608.09 | 1610.73 | 1594.91 | 1596.83 | -11.17 |
| Prev. Close | Volume | Bid | Ask | Time |
| 1596.83 | 0 | 2025-05-28 16:19:52 |
| 52wk High | 825.6562 | 52wk High Date | 2018-01-29 |
| 52wk Low | 678.5654 | 52wk Low Date | 2017-12-06 |