Index Trend Analysis Report
Prepared for you on Friday, May 9, 2025.
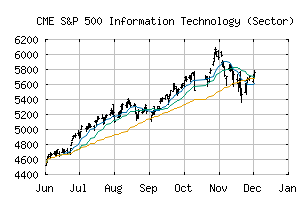
S&P 500 Information Technology (Sector) (CME:SP500-45)
Crossroads (+60) - SP500-45 is struggling to move into a solid trend. Beware of choppy markets and consider a sidelines position until a stronger trend is identified.
Is it time to buy, sell, or avoid SP500-45?
MarketClub looks at technical strength and momentum to determine if the timing is right for SP500-45.
Learn more about the Trade Triangles and how we make technical analysis as easy as buy and sell.
|
|||||||||||||||
|
|||||||||||||||
MarketClub’s Trade Triangles for SP500-45
![]() The long-term trend has been DOWN since Feb 3rd, 2025 at 4354.62
The long-term trend has been DOWN since Feb 3rd, 2025 at 4354.62
![]() The intermediate-term trend has been UP since Apr 29th, 2025 at 4067.84
The intermediate-term trend has been UP since Apr 29th, 2025 at 4067.84
![]() The short-term trend has been UP since May 8th, 2025 at 4219.42
The short-term trend has been UP since May 8th, 2025 at 4219.42
Smart Scan Analysis for SP500-45
Based on our trend formula, SP500-45 is rated as a +60 on a scale from -100 (Strong Downtrend) to +100 (Strong Uptrend).
| Open | High | Low | Price | Change |
|---|---|---|---|---|
| 4239.38 | 4277.01 | 4198.59 | 4233.88 | +35.52 |
| Prev. Close | Volume | Bid | Ask | Time |
| 4233.88 | 827301292 | 2025-05-08 16:19:14 |
| 52wk High | 1338.95 | 52wk High Date | 2018-10-03 |
| 52wk Low | 1057.51 | 52wk Low Date | 2018-02-09 |