Index Trend Analysis Report
Prepared for you on Friday, February 6, 2026.
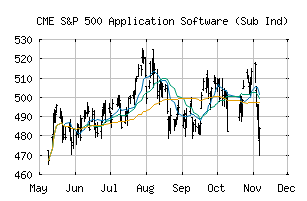
S&P 500 Application Software (Sub Ind) (CME:SP500-45103010)
Long-Term Downtrend (-90) - SP500-45103010 is in a strong downtrend that is likely to continue. While SP500-45103010 is showing intraday strength, it remains in the confines of a bearish trend. Traders should use caution and set stops.
Is it time to buy, sell, or avoid SP500-45103010?
MarketClub looks at technical strength and momentum to determine if the timing is right for SP500-45103010.
Learn more about the Trade Triangles and how we make technical analysis as easy as buy and sell.
|
|||||||||||||||
|
|||||||||||||||
MarketClub’s Trade Triangles for SP500-45103010
![]() The long-term trend has been DOWN since Jan 21st, 2026 at 438.76
The long-term trend has been DOWN since Jan 21st, 2026 at 438.76
![]() The intermediate-term trend has been DOWN since Jan 2nd, 2026 at 492.35
The intermediate-term trend has been DOWN since Jan 2nd, 2026 at 492.35
![]() The short-term trend has been DOWN since Jan 28th, 2026 at 441.84
The short-term trend has been DOWN since Jan 28th, 2026 at 441.84
Smart Scan Analysis for SP500-45103010
Based on our trend formula, SP500-45103010 is rated as a -90 on a scale from -100 (Strong Downtrend) to +100 (Strong Uptrend).
| Open | High | Low | Price | Change |
|---|---|---|---|---|
| 369.67 | 374.08 | 364.83 | 373.54 | +11.49 |
| Prev. Close | Volume | Bid | Ask | Time |
| 362.05 | 116133977 | 2026-02-06 16:18:32 |
| 52wk High | 194.24 | 52wk High Date | 2018-09-14 |
| 52wk Low | 127.7 | 52wk Low Date | 2017-12-05 |