Index Trend Analysis Report
Prepared for you on Wednesday, April 24, 2024.
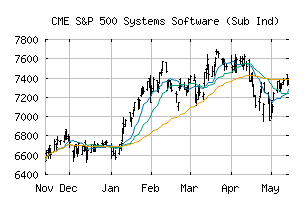
S&P 500 Systems Software (Sub Ind) (CME:SP500-45103020)
Sidelines Mode (-55) - SP500-45103020 is moving in a sideways pattern and is unable to gain momentum in either direction. Beware of choppy movement and consider a sidelines position until a stronger trend is identified.
Is it time to buy, sell, or avoid SP500-45103020?
MarketClub looks at technical strength and momentum to determine if the timing is right for SP500-45103020.
Learn more about the Trade Triangles and how we make technical analysis as easy as buy and sell.
|
|||||||||||||||
|
|||||||||||||||
MarketClub’s Trade Triangles for SP500-45103020
![]() The long-term trend has been UP since Nov 1st, 2023 at 6163.10
The long-term trend has been UP since Nov 1st, 2023 at 6163.10
![]() The intermediate-term trend has been DOWN since Apr 15th, 2024 at 7453.24
The intermediate-term trend has been DOWN since Apr 15th, 2024 at 7453.24
![]() The short-term trend has been UP since Apr 24th, 2024 at 7281.27
The short-term trend has been UP since Apr 24th, 2024 at 7281.27
Smart Scan Analysis for SP500-45103020
Based on our trend formula, SP500-45103020 is rated as a -55 on a scale from -100 (Strong Downtrend) to +100 (Strong Uptrend).
| Open | High | Low | Price | Change |
|---|---|---|---|---|
| 7317.46 | 7353.46 | 7255.36 | 7299.27 | +27.28 |
| Prev. Close | Volume | Bid | Ask | Time |
| 7271.99 | 31285884 | 2024-04-24 17:07:33 |
| 52wk High | 2155.37 | 52wk High Date | 2018-10-01 |
| 52wk Low | 1545.78 | 52wk Low Date | 2017-12-06 |