Index Trend Analysis Report
Prepared for you on Wednesday, July 2, 2025.
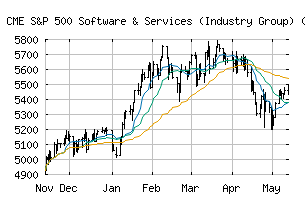
S&P 500 Software & Services (Industry Group) (TR) (CME:SP500-4510TR)
Bull Market Weakness (+75) - SP500-4510TR is showing signs of short-term weakness, but still remains in the confines of a long-term uptrend. Keep an eye on SP500-4510TR as it may be in the beginning stages of a reversal.
Is it time to buy, sell, or avoid SP500-4510TR?
MarketClub looks at technical strength and momentum to determine if the timing is right for SP500-4510TR.
Learn more about the Trade Triangles and how we make technical analysis as easy as buy and sell.
|
|||||||||||||||
|
|||||||||||||||
MarketClub’s Trade Triangles for SP500-4510TR
![]() The long-term trend has been UP since May 8th, 2025 at 6205.35
The long-term trend has been UP since May 8th, 2025 at 6205.35
![]() The intermediate-term trend has been UP since Apr 24th, 2025 at 5570.83
The intermediate-term trend has been UP since Apr 24th, 2025 at 5570.83
![]() The short-term trend has been DOWN since Jul 1st, 2025 at 6809.56
The short-term trend has been DOWN since Jul 1st, 2025 at 6809.56
Smart Scan Analysis for SP500-4510TR
Based on our trend formula, SP500-4510TR is rated as a +75 on a scale from -100 (Strong Downtrend) to +100 (Strong Uptrend).
| Open | High | Low | Price | Change |
|---|---|---|---|---|
| 6890.79 | 6890.79 | 6798.42 | 6825.36 | -65.43 |
| Prev. Close | Volume | Bid | Ask | Time |
| 6825.36 | 0 | 2025-07-01 16:20:05 |
| 52wk High | 2231.14 | 52wk High Date | 2018-07-25 |
| 52wk Low | 1733.83 | 52wk Low Date | 2017-12-05 |