Index Trend Analysis Report
Prepared for you on Saturday, October 26, 2024.
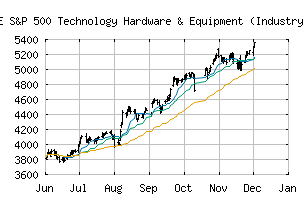
S&P 500 Technology Hardware & Equipment (Industry Group) (CME:SP500-4520)
Bull Market Weakness (+75) - SP500-4520 is showing signs of short-term weakness, but still remains in the confines of a long-term uptrend. Keep an eye on SP500-4520 as it may be in the beginning stages of a reversal.
Is it time to buy, sell, or avoid SP500-4520?
MarketClub looks at technical strength and momentum to determine if the timing is right for SP500-4520.
Learn more about the Trade Triangles and how we make technical analysis as easy as buy and sell.
|
|||||||||||||||
|
|||||||||||||||
MarketClub’s Trade Triangles for SP500-4520
![]() The long-term trend has been UP since May 15th, 2024 at 3544.02
The long-term trend has been UP since May 15th, 2024 at 3544.02
![]() The intermediate-term trend has been UP since Sep 20th, 2024 at 4220.53
The intermediate-term trend has been UP since Sep 20th, 2024 at 4220.53
![]() The short-term trend has been DOWN since Oct 23rd, 2024 at 4268.43
The short-term trend has been DOWN since Oct 23rd, 2024 at 4268.43
Smart Scan Analysis for SP500-4520
Based on our trend formula, SP500-4520 is rated as a +75 on a scale from -100 (Strong Downtrend) to +100 (Strong Uptrend).
| Open | High | Low | Price | Change |
|---|---|---|---|---|
| 4232.17 | 4279.44 | 4232.17 | 4247.94 | +12.56 |
| Prev. Close | Volume | Bid | Ask | Time |
| 4247.94 | 142966215 | 2024-10-25 16:20:08 |
| 52wk High | 1368.94 | 52wk High Date | 2018-10-03 |
| 52wk Low | 961.25 | 52wk Low Date | 2018-02-09 |