Index Trend Analysis Report
Prepared for you on Saturday, December 6, 2025.
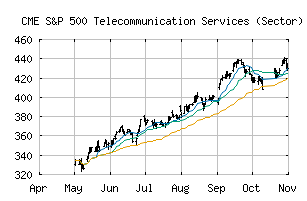
S&P 500 Telecommunication Services (Sector) (CME:SP500-50)
Strong Uptrend (+100) - SP500-50 is in a strong uptrend that is likely to continue. With short-term, intermediate, and long-term bullish momentum, SP500-50 continues to climb. Traders should protect gains and look for a change in score to suggest a slow down in momentum.
Is it time to buy, sell, or avoid SP500-50?
MarketClub looks at technical strength and momentum to determine if the timing is right for SP500-50.
Learn more about the Trade Triangles and how we make technical analysis as easy as buy and sell.
|
|||||||||||||||
|
|||||||||||||||
MarketClub’s Trade Triangles for SP500-50
![]() The long-term trend has been UP since Jun 4th, 2025 at 355.90
The long-term trend has been UP since Jun 4th, 2025 at 355.90
![]() The intermediate-term trend has been UP since Nov 24th, 2025 at 439.88
The intermediate-term trend has been UP since Nov 24th, 2025 at 439.88
![]() The short-term trend has been UP since Dec 4th, 2025 at 456.84
The short-term trend has been UP since Dec 4th, 2025 at 456.84
Smart Scan Analysis for SP500-50
Based on our trend formula, SP500-50 is rated as a +100 on a scale from -100 (Strong Downtrend) to +100 (Strong Uptrend).
| Open | High | Low | Price | Change |
|---|---|---|---|---|
| 457.12 | 462.92 | 457.12 | 460.93 | +4.35 |
| Prev. Close | Volume | Bid | Ask | Time |
| 460.93 | 575946681 | 2025-12-05 16:19:37 |
| 52wk High | 169.66 | 52wk High Date | 2018-02-01 |
| 52wk Low | 140.34 | 52wk Low Date | 2018-05-09 |