Index Trend Analysis Report
Prepared for you on Friday, May 9, 2025.
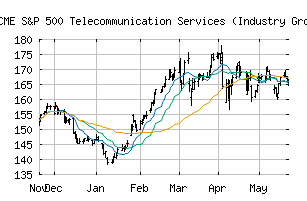
S&P 500 Telecommunication Services (Industry Group) (CME:SP500-5010)
Sidelines Mode (-55) - SP500-5010 is moving in a sideways pattern and is unable to gain momentum in either direction. Beware of choppy movement and consider a sidelines position until a stronger trend is identified.
Is it time to buy, sell, or avoid SP500-5010?
MarketClub looks at technical strength and momentum to determine if the timing is right for SP500-5010.
Learn more about the Trade Triangles and how we make technical analysis as easy as buy and sell.
|
|||||||||||||||
|
|||||||||||||||
MarketClub’s Trade Triangles for SP500-5010
![]() The long-term trend has been UP since Feb 12th, 2025 at 159.06
The long-term trend has been UP since Feb 12th, 2025 at 159.06
![]() The intermediate-term trend has been DOWN since Apr 7th, 2025 at 163.70
The intermediate-term trend has been DOWN since Apr 7th, 2025 at 163.70
![]() The short-term trend has been UP since Apr 30th, 2025 at 164.85
The short-term trend has been UP since Apr 30th, 2025 at 164.85
Smart Scan Analysis for SP500-5010
Based on our trend formula, SP500-5010 is rated as a -55 on a scale from -100 (Strong Downtrend) to +100 (Strong Uptrend).
| Open | High | Low | Price | Change |
|---|---|---|---|---|
| 169.19 | 169.62 | 166.85 | 166.98 | -2.51 |
| Prev. Close | Volume | Bid | Ask | Time |
| 166.98 | 47262436 | 2025-05-08 16:19:08 |
| 52wk High | 169.51 | 52wk High Date | 2018-02-01 |
| 52wk Low | 140.36 | 52wk Low Date | 2018-05-09 |