Index Trend Analysis Report
Prepared for you on Monday, March 16, 2026.
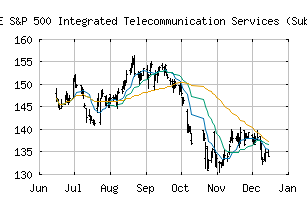
S&P 500 Integrated Telecommunication Services (Sub Ind) (CME:SP500-50101020)
Sidelines Mode (+55) - SP500-50101020 is moving in a sideways pattern and is unable to gain momentum in either direction. Beware of choppy movement and consider a sidelines position until a stronger trend is identified.
Is it time to buy, sell, or avoid SP500-50101020?
MarketClub looks at technical strength and momentum to determine if the timing is right for SP500-50101020.
Learn more about the Trade Triangles and how we make technical analysis as easy as buy and sell.
|
|||||||||||||||
|
|||||||||||||||
MarketClub’s Trade Triangles for SP500-50101020
![]() The long-term trend has been UP since Feb 2nd, 2026 at 144.94
The long-term trend has been UP since Feb 2nd, 2026 at 144.94
![]() The intermediate-term trend has been DOWN since Mar 12th, 2026 at 153.84
The intermediate-term trend has been DOWN since Mar 12th, 2026 at 153.84
![]() The short-term trend has been UP since Mar 13th, 2026 at 157.62
The short-term trend has been UP since Mar 13th, 2026 at 157.62
Smart Scan Analysis for SP500-50101020
Based on our trend formula, SP500-50101020 is rated as a +55 on a scale from -100 (Strong Downtrend) to +100 (Strong Uptrend).
| Open | High | Low | Price | Change |
|---|---|---|---|---|
| 156.97 | 157.13 | 155.70 | 156.87 | -0.09 |
| Prev. Close | Volume | Bid | Ask | Time |
| 156.96 | 40347558 | 2026-03-16 15:03:38 |
| 52wk High | 177.02 | 52wk High Date | 2018-02-01 |
| 52wk Low | 145.38 | 52wk Low Date | 2018-05-09 |