Index Trend Analysis Report
Prepared for you on Sunday, April 5, 2026.
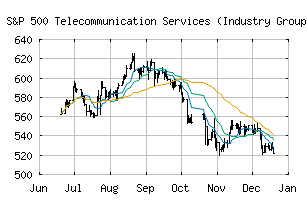
S&P 500 Telecommunication Services (Industry Group) (TR) (CME:SP500-5010TR)
Crossroads (-60) - SP500-5010TR is struggling to move into a solid trend. Beware of choppy markets and consider a sidelines position until a stronger trend is identified.
Is it time to buy, sell, or avoid SP500-5010TR?
MarketClub looks at technical strength and momentum to determine if the timing is right for SP500-5010TR.
Learn more about the Trade Triangles and how we make technical analysis as easy as buy and sell.
|
|||||||||||||||
|
|||||||||||||||
MarketClub’s Trade Triangles for SP500-5010TR
![]() The long-term trend has been UP since Feb 2nd, 2026 at 569.83
The long-term trend has been UP since Feb 2nd, 2026 at 569.83
![]() The intermediate-term trend has been DOWN since Mar 12th, 2026 at 607.03
The intermediate-term trend has been DOWN since Mar 12th, 2026 at 607.03
![]() The short-term trend has been DOWN since Mar 31st, 2026 at 614.91
The short-term trend has been DOWN since Mar 31st, 2026 at 614.91
Smart Scan Analysis for SP500-5010TR
Based on our trend formula, SP500-5010TR is rated as a -60 on a scale from -100 (Strong Downtrend) to +100 (Strong Uptrend).
| Open | High | Low | Price | Change |
|---|---|---|---|---|
| 602.70 | 606.60 | 596.66 | 601.10 | -1.60 |
| Prev. Close | Volume | Bid | Ask | Time |
| 601.10 | 0 | 2026-04-02 16:19:05 |
| 52wk High | 409.88 | 52wk High Date | 2018-02-01 |
| 52wk Low | 344.17 | 52wk Low Date | 2018-05-09 |