Index Trend Analysis Report
Prepared for you on Thursday, February 26, 2026.
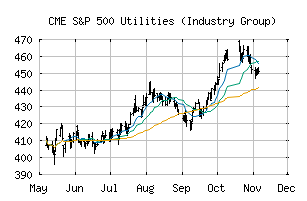
S&P 500 Utilities (Industry Group) (CME:SP500-5510)
Long-Term Uptrend (+90) - SP500-5510 is in a strong uptrend that is likely to continue. While SP500-5510 is showing intraday weakness, it remains in the confines of a bullish trend. Traders should use caution and utilize a stop order.
Is it time to buy, sell, or avoid SP500-5510?
MarketClub looks at technical strength and momentum to determine if the timing is right for SP500-5510.
Learn more about the Trade Triangles and how we make technical analysis as easy as buy and sell.
|
|||||||||||||||
|
|||||||||||||||
MarketClub’s Trade Triangles for SP500-5510
![]() The long-term trend has been UP since Feb 12th, 2026 at 458.41
The long-term trend has been UP since Feb 12th, 2026 at 458.41
![]() The intermediate-term trend has been UP since Jan 15th, 2026 at 440.94
The intermediate-term trend has been UP since Jan 15th, 2026 at 440.94
![]() The short-term trend has been UP since Feb 4th, 2026 at 441.45
The short-term trend has been UP since Feb 4th, 2026 at 441.45
Smart Scan Analysis for SP500-5510
Based on our trend formula, SP500-5510 is rated as a +90 on a scale from -100 (Strong Downtrend) to +100 (Strong Uptrend).
| Open | High | Low | Price | Change |
|---|---|---|---|---|
| 479.51 | 479.69 | 475.23 | 477.06 | -2.54 |
| Prev. Close | Volume | Bid | Ask | Time |
| 479.60 | 56011975 | 2026-02-26 12:20:23 |
| 52wk High | 286.94 | 52wk High Date | 2017-12-01 |
| 52wk Low | 240.4 | 52wk Low Date | 2018-02-06 |