Index Trend Analysis Report
Prepared for you on Tuesday, March 17, 2026.
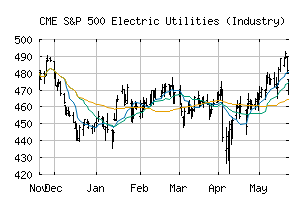
S&P 500 Electric Utilities (Industry) (CME:SP500-551010)
Strong Uptrend (+100) - SP500-551010 is in a strong uptrend that is likely to continue. With short-term, intermediate, and long-term bullish momentum, SP500-551010 continues to climb. Traders should protect gains and look for a change in score to suggest a slow down in momentum.
Is it time to buy, sell, or avoid SP500-551010?
MarketClub looks at technical strength and momentum to determine if the timing is right for SP500-551010.
Learn more about the Trade Triangles and how we make technical analysis as easy as buy and sell.
|
|||||||||||||||
|
|||||||||||||||
MarketClub’s Trade Triangles for SP500-551010
![]() The long-term trend has been UP since Feb 12th, 2026 at 542.25
The long-term trend has been UP since Feb 12th, 2026 at 542.25
![]() The intermediate-term trend has been UP since Jan 15th, 2026 at 521.92
The intermediate-term trend has been UP since Jan 15th, 2026 at 521.92
![]() The short-term trend has been UP since Mar 13th, 2026 at 564.83
The short-term trend has been UP since Mar 13th, 2026 at 564.83
Smart Scan Analysis for SP500-551010
Based on our trend formula, SP500-551010 is rated as a +100 on a scale from -100 (Strong Downtrend) to +100 (Strong Uptrend).
| Open | High | Low | Price | Change |
|---|---|---|---|---|
| 568.78 | 568.78 | 562.27 | 565.92 | +3.21 |
| Prev. Close | Volume | Bid | Ask | Time |
| 565.92 | 84282602 | 2026-03-16 16:18:08 |
| 52wk High | 318.49 | 52wk High Date | 2017-12-01 |
| 52wk Low | 264.54 | 52wk Low Date | 2018-02-06 |