Index Trend Analysis Report
Prepared for you on Sunday, March 22, 2026.
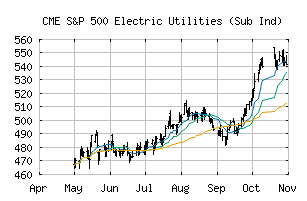
S&P 500 Electric Utilities (Sub Ind) (CME:SP500-55101010)
Weak Downtrend (-65) - SP500-55101010 is showing signs of a strengthening downtrend. Monitor SP500-55101010 as it may be building momentum to the downside.
Is it time to buy, sell, or avoid SP500-55101010?
MarketClub looks at technical strength and momentum to determine if the timing is right for SP500-55101010.
Learn more about the Trade Triangles and how we make technical analysis as easy as buy and sell.
|
|||||||||||||||
|
|||||||||||||||
MarketClub’s Trade Triangles for SP500-55101010
![]() The long-term trend has been UP since Feb 12th, 2026 at 542.25
The long-term trend has been UP since Feb 12th, 2026 at 542.25
![]() The intermediate-term trend has been DOWN since Mar 19th, 2026 at 552.23
The intermediate-term trend has been DOWN since Mar 19th, 2026 at 552.23
![]() The short-term trend has been DOWN since Mar 18th, 2026 at 561.64
The short-term trend has been DOWN since Mar 18th, 2026 at 561.64
Smart Scan Analysis for SP500-55101010
Based on our trend formula, SP500-55101010 is rated as a -70 on a scale from -100 (Strong Downtrend) to +100 (Strong Uptrend).
| Open | High | Low | Price | Change |
|---|---|---|---|---|
| 557.51 | 559.50 | 532.29 | 534.13 | -23.14 |
| Prev. Close | Volume | Bid | Ask | Time |
| 534.13 | 174696953 | 2026-03-20 16:19:38 |
| 52wk High | 318.49 | 52wk High Date | 2017-12-01 |
| 52wk Low | 264.54 | 52wk Low Date | 2018-02-06 |