Index Trend Analysis Report
Prepared for you on Saturday, April 4, 2026.
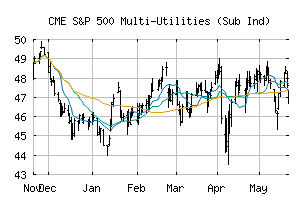
S&P 500 Multi-Utilities (Sub Ind) (CME:SP500-55103010)
Bull Market Weakness (+75) - SP500-55103010 is showing signs of short-term weakness, but still remains in the confines of a long-term uptrend. Keep an eye on SP500-55103010 as it may be in the beginning stages of a reversal.
Is it time to buy, sell, or avoid SP500-55103010?
MarketClub looks at technical strength and momentum to determine if the timing is right for SP500-55103010.
Learn more about the Trade Triangles and how we make technical analysis as easy as buy and sell.
|
|||||||||||||||
|
|||||||||||||||
MarketClub’s Trade Triangles for SP500-55103010
![]() The long-term trend has been UP since Jul 22nd, 2025 at 49.04
The long-term trend has been UP since Jul 22nd, 2025 at 49.04
![]() The intermediate-term trend has been DOWN since Mar 20th, 2026 at 52.47
The intermediate-term trend has been DOWN since Mar 20th, 2026 at 52.47
![]() The short-term trend has been UP since Mar 26th, 2026 at 52.90
The short-term trend has been UP since Mar 26th, 2026 at 52.90
Smart Scan Analysis for SP500-55103010
Based on our trend formula, SP500-55103010 is rated as a +75 on a scale from -100 (Strong Downtrend) to +100 (Strong Uptrend).
| Open | High | Low | Price | Change |
|---|---|---|---|---|
| 53.86 | 54.45 | 53.74 | 54.35 | +0.62 |
| Prev. Close | Volume | Bid | Ask | Time |
| 54.35 | 20965333 | 2026-04-02 16:19:08 |
| 52wk High | 39.83 | 52wk High Date | 2017-12-01 |
| 52wk Low | 32.81 | 52wk Low Date | 2018-06-07 |