Index Trend Analysis Report
Prepared for you on Friday, March 27, 2026.
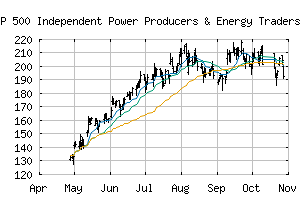
S&P 500 Independent Power Producers & Energy Traders (Sub Ind) (CME:SP500-55105010)
Countertrend Down (-85) - SP500-55105010 is showing short-term strength. However, look for the longer-term bearish trend to resume. As always, continue to monitor the trend score and set stops.
Is it time to buy, sell, or avoid SP500-55105010?
MarketClub looks at technical strength and momentum to determine if the timing is right for SP500-55105010.
Learn more about the Trade Triangles and how we make technical analysis as easy as buy and sell.
|
|||||||||||||||
|
|||||||||||||||
MarketClub’s Trade Triangles for SP500-55105010
![]() The long-term trend has been DOWN since Nov 13th, 2025 at 182.11
The long-term trend has been DOWN since Nov 13th, 2025 at 182.11
![]() The intermediate-term trend has been DOWN since Mar 20th, 2026 at 162.67
The intermediate-term trend has been DOWN since Mar 20th, 2026 at 162.67
![]() The short-term trend has been UP since Mar 27th, 2026 at 166.94
The short-term trend has been UP since Mar 27th, 2026 at 166.94
Smart Scan Analysis for SP500-55105010
Based on our trend formula, SP500-55105010 is rated as a -85 on a scale from -100 (Strong Downtrend) to +100 (Strong Uptrend).
| Open | High | Low | Price | Change |
|---|---|---|---|---|
| 162.35 | 168.65 | 162.35 | 164.57 | +2.78 |
| Prev. Close | Volume | Bid | Ask | Time |
| 161.79 | 23600000 | 2026-03-27 16:31:13 |
| 52wk High | 101.33 | 52wk High Date | 2018-11-12 |
| 52wk Low | 61.59 | 52wk Low Date | 2018-02-09 |