Index Trend Analysis Report
Prepared for you on Thursday, January 2, 2025.
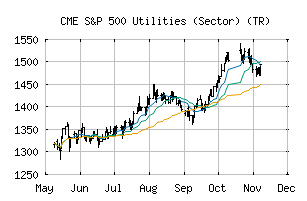
S&P 500 Utilities (Sector) (TR) (CME:SP500-55TR)
Bear Market Rally (-75) - SP500-55TR is showing some rallying power, but still remains in the confines of a long-term downtrend. Keep an eye on SP500-55TR as it may be in the beginning of a reversal.
Is it time to buy, sell, or avoid SP500-55TR?
MarketClub looks at technical strength and momentum to determine if the timing is right for SP500-55TR.
Learn more about the Trade Triangles and how we make technical analysis as easy as buy and sell.
|
|||||||||||||||
|
|||||||||||||||
MarketClub’s Trade Triangles for SP500-55TR
![]() The long-term trend has been DOWN since Dec 18th, 2024 at 1218.18
The long-term trend has been DOWN since Dec 18th, 2024 at 1218.18
![]() The intermediate-term trend has been DOWN since Dec 9th, 2024 at 1280.36
The intermediate-term trend has been DOWN since Dec 9th, 2024 at 1280.36
![]() The short-term trend has been UP since Jan 2nd, 2025 at 1245.04
The short-term trend has been UP since Jan 2nd, 2025 at 1245.04
Smart Scan Analysis for SP500-55TR
Based on our trend formula, SP500-55TR is rated as a -75 on a scale from -100 (Strong Downtrend) to +100 (Strong Uptrend).
| Open | High | Low | Price | Change |
|---|---|---|---|---|
| 1234.99 | 1250.81 | 1234.99 | 1243.03 | +8.04 |
| Prev. Close | Volume | Bid | Ask | Time |
| 1234.99 | 0 | 2025-01-02 11:16:34 |
| 52wk High | 740.15 | 52wk High Date | 2018-11-20 |
| 52wk Low | 613.3 | 52wk Low Date | 2018-02-06 |