Index Trend Analysis Report
Prepared for you on Friday, December 19, 2025.
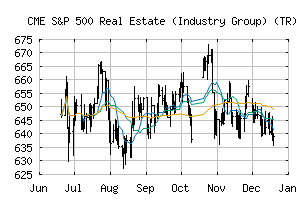
S&P 500 Real Estate (Industry Group) (TR) (CME:SP500-6010TR)
Long-Term Downtrend (-90) - SP500-6010TR is in a strong downtrend that is likely to continue. While SP500-6010TR is showing intraday strength, it remains in the confines of a bearish trend. Traders should use caution and set stops.
Is it time to buy, sell, or avoid SP500-6010TR?
MarketClub looks at technical strength and momentum to determine if the timing is right for SP500-6010TR.
Learn more about the Trade Triangles and how we make technical analysis as easy as buy and sell.
|
|||||||||||||||
|
|||||||||||||||
MarketClub’s Trade Triangles for SP500-6010TR
![]() The long-term trend has been DOWN since Dec 19th, 2025 at 635.93
The long-term trend has been DOWN since Dec 19th, 2025 at 635.93
![]() The intermediate-term trend has been DOWN since Dec 18th, 2025 at 639.12
The intermediate-term trend has been DOWN since Dec 18th, 2025 at 639.12
![]() The short-term trend has been DOWN since Dec 2nd, 2025 at 648.25
The short-term trend has been DOWN since Dec 2nd, 2025 at 648.25
Smart Scan Analysis for SP500-6010TR
Based on our trend formula, SP500-6010TR is rated as a -90 on a scale from -100 (Strong Downtrend) to +100 (Strong Uptrend).
| Open | High | Low | Price | Change |
|---|---|---|---|---|
| 638.30 | 639.89 | 635.76 | 639.89 | +1.64 |
| Prev. Close | Volume | Bid | Ask | Time |
| 638.25 | 0 | 2025-12-19 12:39:09 |