Index Trend Analysis Report
Prepared for you on Friday, July 26, 2024.
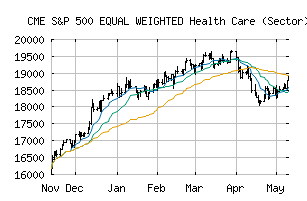
S&P 500 EQUAL WEIGHTED Health Care (Sector) (CME:SP500EW-35)
Crossroads (+60) - SP500EW-35 is struggling to move into a solid trend. Beware of choppy markets and consider a sidelines position until a stronger trend is identified.
Is it time to buy, sell, or avoid SP500EW-35?
MarketClub looks at technical strength and momentum to determine if the timing is right for SP500EW-35.
Learn more about the Trade Triangles and how we make technical analysis as easy as buy and sell.
|
|||||||||||||||
|
|||||||||||||||
MarketClub’s Trade Triangles for SP500EW-35
![]() The long-term trend has been DOWN since Apr 17th, 2024 at 18216.48
The long-term trend has been DOWN since Apr 17th, 2024 at 18216.48
![]() The intermediate-term trend has been UP since Jul 12th, 2024 at 18909.38
The intermediate-term trend has been UP since Jul 12th, 2024 at 18909.38
![]() The short-term trend has been UP since Jul 8th, 2024 at 18377.76
The short-term trend has been UP since Jul 8th, 2024 at 18377.76
Smart Scan Analysis for SP500EW-35
Based on our trend formula, SP500EW-35 is rated as a +60 on a scale from -100 (Strong Downtrend) to +100 (Strong Uptrend).
| Open | High | Low | Price | Change |
|---|---|---|---|---|
| 19091.32 | 19297.73 | 19066.69 | 19218.68 | +127.36 |
| Prev. Close | Volume | Bid | Ask | Time |
| 19091.32 | 0 | 2024-07-26 16:20:00 |
| 52wk High | 12819.06 | 52wk High Date | 2018-10-01 |
| 52wk Low | 10669.73 | 52wk Low Date | 2018-04-06 |