Index Trend Analysis Report
Prepared for you on Monday, March 23, 2026.
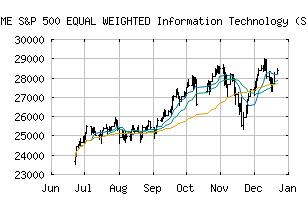
S&P 500 EQUAL WEIGHTED Information Technology (Sector) (CME:SP500EW-45)
Crossroads (+60) - SP500EW-45 is struggling to move into a solid trend. Beware of choppy markets and consider a sidelines position until a stronger trend is identified.
Is it time to buy, sell, or avoid SP500EW-45?
MarketClub looks at technical strength and momentum to determine if the timing is right for SP500EW-45.
Learn more about the Trade Triangles and how we make technical analysis as easy as buy and sell.
|
|||||||||||||||
|
|||||||||||||||
MarketClub’s Trade Triangles for SP500EW-45
![]() The long-term trend has been UP since Jun 5th, 2025 at 23641.10
The long-term trend has been UP since Jun 5th, 2025 at 23641.10
![]() The intermediate-term trend has been DOWN since Feb 3rd, 2026 at 28140.31
The intermediate-term trend has been DOWN since Feb 3rd, 2026 at 28140.31
![]() The short-term trend has been DOWN since Mar 20th, 2026 at 27893.53
The short-term trend has been DOWN since Mar 20th, 2026 at 27893.53
Smart Scan Analysis for SP500EW-45
Based on our trend formula, SP500EW-45 is rated as a +60 on a scale from -100 (Strong Downtrend) to +100 (Strong Uptrend).
| Open | High | Low | Price | Change |
|---|---|---|---|---|
| 27931.55 | 28813.38 | 27931.55 | 28437.15 | +505.60 |
| Prev. Close | Volume | Bid | Ask | Time |
| 27931.55 | 0 | 2026-03-23 14:27:55 |
| 52wk High | 10351.64 | 52wk High Date | 2018-09-21 |
| 52wk Low | 8412.15 | 52wk Low Date | 2018-02-09 |