Index Trend Analysis Report
Prepared for you on Tuesday, April 23, 2024.
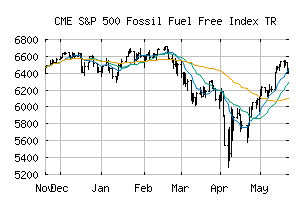
S&P 500 Fossil Fuel Free Index TR (CME:SP5F3UT)
Weak Downtrend (-65) - SP5F3UT is showing signs of a strengthening downtrend. Monitor SP5F3UT as it may be building momentum to the downside.
Is it time to buy, sell, or avoid SP5F3UT?
MarketClub looks at technical strength and momentum to determine if the timing is right for SP5F3UT.
Learn more about the Trade Triangles and how we make technical analysis as easy as buy and sell.
|
|||||||||||||||
|
|||||||||||||||
MarketClub’s Trade Triangles for SP5F3UT
![]() The long-term trend has been UP since Nov 22nd, 2023 at 4874.54
The long-term trend has been UP since Nov 22nd, 2023 at 4874.54
![]() The intermediate-term trend has been DOWN since Apr 12th, 2024 at 5503.41
The intermediate-term trend has been DOWN since Apr 12th, 2024 at 5503.41
![]() The short-term trend has been DOWN since Apr 2nd, 2024 at 5598.17
The short-term trend has been DOWN since Apr 2nd, 2024 at 5598.17
Smart Scan Analysis for SP5F3UT
Based on our trend formula, SP5F3UT is rated as a -70 on a scale from -100 (Strong Downtrend) to +100 (Strong Uptrend).
| Open | High | Low | Price | Change |
|---|---|---|---|---|
| 5335.62 | 5412.56 | 5335.62 | 5382.45 | +46.83 |
| Prev. Close | Volume | Bid | Ask | Time |
| 5382.45 | 0 | 2024-04-22 16:19:57 |