Index Trend Analysis Report
Prepared for you on Wednesday, October 15, 2025.
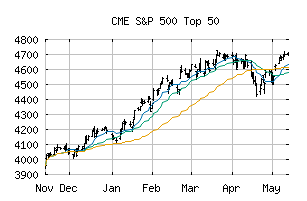
S&P 500 Top 50 (CME:SP5T5)
Sidelines Mode (+55) - SP5T5 is moving in a sideways pattern and is unable to gain momentum in either direction. Beware of choppy movement and consider a sidelines position until a stronger trend is identified.
Is it time to buy, sell, or avoid SP5T5?
MarketClub looks at technical strength and momentum to determine if the timing is right for SP5T5.
Learn more about the Trade Triangles and how we make technical analysis as easy as buy and sell.
|
|||||||||||||||
|
|||||||||||||||
MarketClub’s Trade Triangles for SP5T5
![]() The long-term trend has been UP since Jun 3rd, 2025 at 5538.31
The long-term trend has been UP since Jun 3rd, 2025 at 5538.31
![]() The intermediate-term trend has been UP since Apr 28th, 2025 at 5083.08
The intermediate-term trend has been UP since Apr 28th, 2025 at 5083.08
![]() The short-term trend has been DOWN since Oct 10th, 2025 at 6407.89
The short-term trend has been DOWN since Oct 10th, 2025 at 6407.89
Smart Scan Analysis for SP5T5
Based on our trend formula, SP5T5 is rated as a +55 on a scale from -100 (Strong Downtrend) to +100 (Strong Uptrend).
| Open | High | Low | Price | Change |
|---|---|---|---|---|
| 6476.24 | 6501.86 | 6278.88 | 6280.86 | -192.72 |
| Prev. Close | Volume | Bid | Ask | Time |
| 6280.86 | 0 | 2025-10-10 16:19:21 |